A widening income gap between rich and poor has been the rallying cry of the Occupy movement to rein in the power of corporations and give the middle class greater access to education, health care and employment.
Clark County, however, seems to be less affected by extreme income inequality than the rest of the nation, according to a Census Bureau report released this month. That could be the result of the county’s role as a Portland suburb and longtime enclave of middle-income families, said Scott Bailey, regional economist with the state Employment Security Department.
“I think maybe its character as a suburban county has a lot to do with it,” Bailey said.
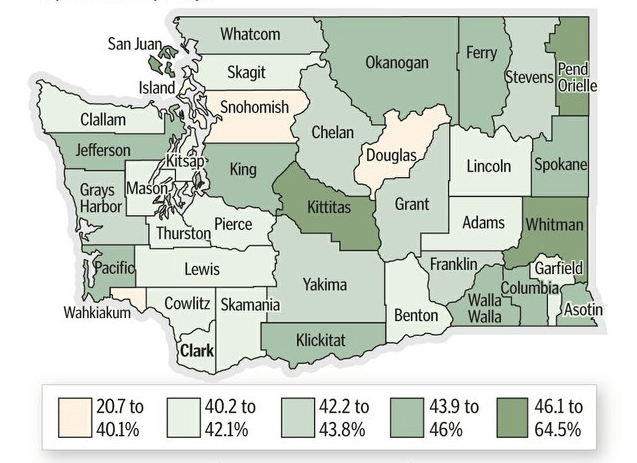
The Census Bureau used the Gini index to measure income inequality in every county in the nation between 2006 and 2010, based on the American Community Survey. Unlike the Census — an exact count — the annual survey produces an estimate. The Gini index ranges from a score of 0 to 1. A value of zero indicates perfect equality, with all households having equal income. A score of 1, or 100 percent, is perfect inequality, with only one household having all the income.
Clark County’s income gap is about 41.6 percent compared with a national average of nearly 47 percent. Across the state, Wahkiakum County had the smallest income gap of 38.6 percent; Whitman County had the largest at 49.8 percent.
A few factors keep Clark County residents on relatively equal income footing, Bailey said.
First, both Clark County’s median annual family household income of $65,612 and median household income of $56,589 are greater than the national average. The national averages are $60,609
for a family household and $49,445 for any household. At the same time, the county’s poverty rate is lower than the nation’s: 11.6 percent versus 15.1 percent. Nearly 60 percent of all Clark County households earn more than $50,000 per year, according to the Census Bureau. About 20.8 percent earn $100,000 or more.
“That indicates that we have relatively fewer households and families at the extremes, which would make for a more equitable distribution of income relative to the nation,” Bailey said.
But why is Clark County’s population of more than 425,000 so persistently middle class?
“In part, it may be because the county is a suburb and not very diverse,” Bailey said. “Houses are newer and tended to be more expensive but not outlandish. Portland may have an effect, in that a fair number of people who move here are from Portland and tend not to be lower income.”
Clark County illustrated a larger trend in the Census data.
“Many of the counties with low Gini indexes were either very low in population or a fast-growing county containing commuter towns within a large metropolitan area,” the Census report states.
Before the recession, Clark County was the fastest-growing county in the state. About 60,000 of the county’s population of 425,000 crosses the Oregon border to work in the Portland area.
The Census Bureau’s data show that the most populous counties were the more disparate in incomes.
Multnomah County in Oregon is an example. That county’s income gap is at 46.8 percent.
Thirty-four percent of Americans lived in a county that ranked in the top 20 percent of U.S. counties with the most income inequality. The South had a disproportionately large number of counties with high income inequality. The Midwest showed the opposite effect, with less inequality. The West and the East fell in between.
To read the full report, click here.
Paris Achen: 360-735-4551; http://twitter.com/Col_Trends; http://facebook.com/ColTrends; paris.achen@columbian.com.