Perhaps you think you can characterize Washington drivers pretty accurately. After all, you’ve observed how often they signal, how closely they follow other cars, how fast they go down Interstate 5, and you’ve heard how often they lay on the horn.
But I bet you two traffic tickets and a gallon of gas that you don’t know everything. A look back at this year in traffic data reveals some interesting tidbits about attitudes, behaviors and trends among Washington drivers.
What percentage of people wear seat belts in Washington?
Washington boasts the highest seat belt usage rate of any state — 97.5 percent, according to the National Highway Traffic Safety Administration. Oregon is not far behind at 96.6 percent. The national average is 84 percent.
Curious which state you’ll find the most unbuckled occupants? It’s Massachusetts, with a 77.3 percent usage rate. This rate is an improvement, though; in 2004, 63.3 percent of people in the Bay State wore seat belts.
What percentage of people wear seat belts in Clark County?
A whopping 99.1 percent. We’re bringing up the state average! In 1986 the local seat belt usage rate was 39.9 percent.
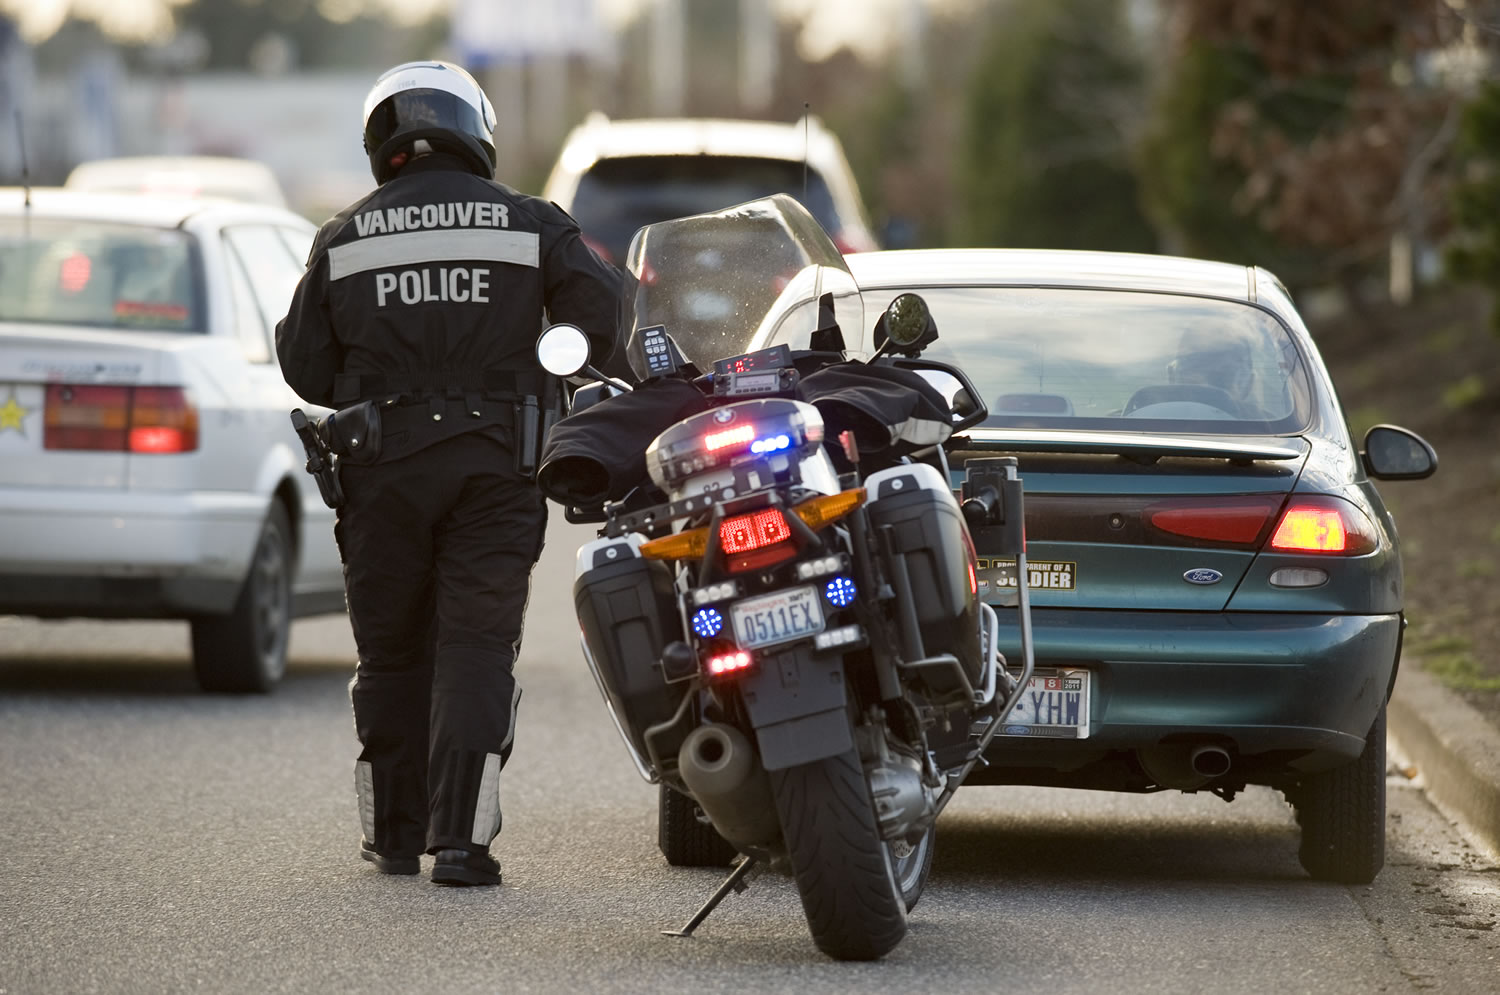
What stretch of 60 mph freeway in Vancouver has consistently made the state’s top 10 list for speeding?
Interstate 205 southbound at Mill Plain Boulevard. In the last quarter of 2011, it reported the highest average speed for a 60 mph zone: 65.3 mph, according to the Washington State Department of Transportation. This area’s ranking dropped to ninth in the first quarter of 2012, back up to eighth in the second quarter and then was sixth-fastest in the third quarter.
Speeding is common on interstate freeways across the state, with more than half of all drivers observed going over the posted speed limit.
Speaking of speeding — what percentage of Washington drivers think they’re likely to get a ticket for going 68 mph in a 60 mph zone?
In a 2012 survey conducted by the Washington Traffic Safety Commission, 78 percent of respondents said they would be very likely or somewhat likely to get a ticket for going eight miles over the speed limit. Trooper Will Finn, spokesman for the Washington State Patrol, says troopers take multiple factors into account when deciding whether to pull someone over for speeding. They consider how heavy traffic is, what the weather conditions are and if the driver is following too closely or driving aggressively.
So, what if a driver hits all those factors during the busy winter holiday travel season?
“Absolutely, we’re going to stop him,” Finn said.
It’s up to the discretion of the trooper to decide whether to ticket the driver.
Through which two media outlets do Washington drivers most commonly learn about speed enforcement?
Among the surveyed drivers, 47.1 percent said television was the most common way they heard or saw a campaign about speed enforcement while 40.8 percent said radio. Interestingly, most young adults (ages 18 to 24) get their info on speed enforcement from electronic signs. It’s also the most popular means in the Vancouver area.
Did the state’s traffic fatality rate increase or decrease from 2010 to 2011?
OK, that was a trick question. It stayed the same; in 2010 the fatality rate dipped to 0.80 per 100 million vehicle miles traveled, the lowest rate in state history, and stayed there.
What factor is involved in the majority of fatal traffic accidents in Clark County?
Impaired driving. According to the Washington Traffic Safety Commission’s 2012 report, 50.9 percent of fatal accidents involve drivers under the influence of alcohol or drugs. A lot of fatal accidents also involved young drivers (42.6 percent) or speeding (40.7 percent).
These factors are the top three priorities for the local Target Zero program, which aims to eliminate traffic fatalities and serious injuries by 2030.
What factor is involved in half of all fatal traffic accidents in Vancouver?
Speeding. Distracted driving is another factor involved in a lot of fatal accidents — 42.9 percent of them to be exact. Impaired driving and young driver-involved fatals aren’t far behind, each getting 39.3 percent.
What factor is involved in just over one-third of all fatal traffic accidents in both the county and the city? Hint: It hasn’t been mentioned yet.
Being run off the road. This factor is the top Target Zero priority for the Southwest Washington Regional Transportation Planning Organization.
What percentage of Washington drivers reported seeing something about drunken driving enforcement in the last two months?
Among the drivers surveyed by the Traffic Safety Commission, 76 percent reported seeing, reading or hearing something about drunken driving enforcement within the last 60 days. Most of them saw campaigns on television.
How many drivers think they’re likely to get arrested if they drive drunk?
Nine out of 10 drivers in the survey said they would be likely or somewhat likely to get arrested if they were drunk behind the wheel.
Let’s compare young female and male drivers, ages 18 to 24. Who’s less likely to think they’ll probably get arrested if they drive drunk?
Young females. In the survey, 73 percent of young females said they were very likely to get arrested if they drive drunk, compared with 81 percent of males in the same age group.
How many drivers reported driving within two hours of drinking in the last two months?
One in 10 drivers said they drove within two hours of drinking in the last 60 days. One in 100 drivers reported doing this six or more times.
What percentage of surveyed drivers reported talking on a cell phone, or sending or receiving a text message while driving in the past 30 days?
Seventy-eight percent of drivers reported texting or talking while driving in the last month. Among that percentage, 16 percent reported sending or receiving a text message or email while driving.
Behaviors vary greatly with age. Among young adults, age 18 to 24, the numbers go up: About one-third reported sending or receiving a text message while driving.
What are top five states that Washington drivers are moving to?
- Oregon
- Idaho
- Florida
- Nevada
- Colorado
The areas where Washington drivers are relocating is more spread out than it was 10 years ago, according to numbers from the Washington State Department of Licensing. For years California used to be Washingtonians’ most popular destination. Now, the reverse is true: Most people registering for Washington licenses are from California. This year 25,677 people from California registered for licenses in Washington, as of November 2012.
Bonus question: What’s the chance of colliding with a deer in Washington?
The chance is 1 in 477.2. State Farm Insurance ranks Washington 43rd for likelihood of crashing into a deer. Poor West Virginia; it gets the No. 1 spot every year. Your chance of hitting a deer there is 1 in 39.9.