Census data show Hispanic, mixed-race residents on rise
By Patty Hastings, Columbian
Social Services, Demographics, Faith
Published: June 22, 2016, 9:01pm
Share:
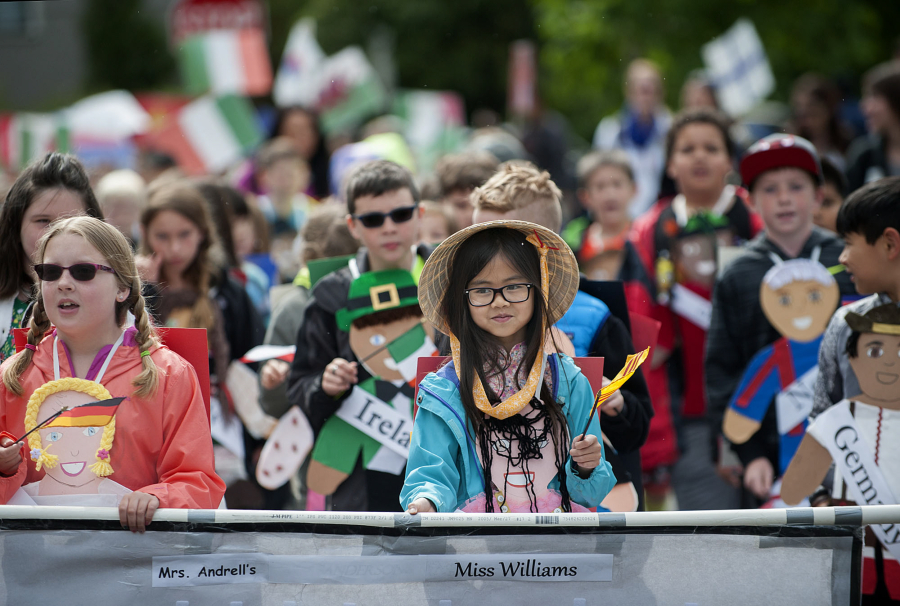
Lake Shore Elementary School third-grader Madison Nguyen, 9, center, honors the country of Vietnam while leading classmates along the parade route May 27 at Fort Vancouver National Historic Site. (Amanda Cowan/The Columbian files)
Clark County is the most rapidly diversifying county in the Portland metropolitan area, thanks primarily to its youngest residents.
As older, whiter generations die, they’re being replaced by a more mixed group of youth, particularly those of Hispanic origin or who identify with two or more races. About 79 percent of Clark County’s population describes itself as non-Hispanic white, according to 2015 U.S. Census estimates released today. But less than 70 percent of local children identify as non-Hispanic white.
At the last official Census in 2010, about 82 percent of the local population identified as white. While not a huge difference, it’s more change than surrounding counties experienced during the same period. The population of Multnomah County, Ore., for instance, stayed 71 percent white between 2010 and 2015.
That may not come as a surprise to anybody who’s been around for a while and knows that the area — and the Northwest, in general — has been overwhelmingly white for decades. At the last official Census in 2010, Portland was determined to be the whitest big city in the country, and Seattle had the fifth-greatest population of white people.
Census data
Portland metropolitan counties ranked by racial diversity:
1. Washington County, Ore.
2. Multnomah County, Ore.
3. Yamhill County, Ore.
4. Clark County
5. Clackamas County, Ore.
As a suburb of Portland, Clark County follows a similar pattern. However, while Portland had historically segregated neighborhoods, the Vancouver Housing Authority and the community decided that people should be integrated and live wherever they want to live, said Jane Elder Wulff, author of “First Families of Vancouver’s African American Community: From World War II to the Twenty-First Century.” She worked on the project with Cornetta Smith with help from people and organizations including the Clark County Historical Museum.
“There was no statistically black population in Vancouver or Clark County until 1942,” Wulff said. “That was when people started to arrive.”
The Vancouver branch of the National Association for the Advancement of Colored People, also known as the NAACP, was chartered in 1945 when there were thousands of black residents.
While the lack of segregation was seen as a win, it also means that minority communities here today can be geographically and culturally fragmented. Although the Census released only county-level data today, one can get an idea of which neighborhoods are more diverse by looking at the racial breakdown of Clark County public schools.
Vancouver and Evergreen, Clark County’s two largest school districts, were 61 and 62 percent white, respectively, according to data gathered in October 2014 by the Office of the Superintendent of Public Instruction.
Nearly one in four students in Vancouver Public Schools identified as Hispanic or Latino. Hispanic or Latino students are the largest minority at all school districts in Clark County. Hispanics are also the largest minority group overall, representing about 9 percent of the total population, according to the Census. (The Census considers Hispanic origin as an ethnicity, not a race.)
More than half of the students at King Elementary, in Vancouver’s Harney Heights neighborhood, identify as Hispanic or Latino. Nearby McLoughlin Middle School and Roosevelt Elementary School also have student populations that are about half Hispanic or Latino.
Students identifying as two or more races is the county’s second-largest minority. Evergreen Public Schools had the largest population of students who identify as two or more races, 7.7 percent. The district also had the largest population of Asian students, who represented 6.6 percent of the student body in 2014. Camas followed closely behind Evergreen; 5.9 percent of students were Asian and 7.5 percent were two or more races. Camas’ student body was 77.2 percent white in 2014.
Rural areas in Clark County, at least according to the OSPI data, tend to be less diverse. Besides the tiny Green Mountain School District, Hockinson has the least diverse student body. In 2014, more than 90 percent of the student body identified as white.
Overall, Washington state schools were 57 percent white, 21.7 percent Hispanic, 7.2 percent Asian and 7.1 percent two or more races in 2014.
Multicultural kids
The largest minority group are Hispanics, who represent 9 percent of the total population and 16 percent of children younger than 8 years old. That population grew 29 percent between 2010 and 2015, which doesn’t surprise Felisciana Peralta, multicultural retention manager at Clark College, considering that the Hispanic population is growing around the country.
Rosalba Pitkin, who works at the college’s Office of Diversity and Equity, points out that there are much larger populations of Hispanics and Latinos in Adams, Franklin, Yakima and Grant counties.
Those are farm areas that attract people looking for jobs in Washington’s agricultural sector, she said.
Starting with the 2000 Census, people could identify as two or more races. That multirace population grew by 18 percent from 2010 to 2015 and represents 3.5 percent of the population.
The smallest minority population, which the Census describes as Native Hawaiian and other Pacific Islander, is also the fastest-growing group in Clark County.
About 0.7 percent of the county identifies as such, compared with 0.2 percent nationally. Many people come to Clark County from Chuuk, a cluster of islands in the Federated States of Micronesia.
The Pacific Islander designation in the Census has evolved over the years, but wasn’t introduced until 1990.
Morning Briefing Newsletter
Get a rundown of the latest local and regional news every Mon-Fri morning.